
Asset management is a critical process for any company that wants to ensure the efficiency and productivity of its physical assets and equipment. One of the most useful tools for investigating unexpected asset failures is the Ishikawa diagram, also known as the fishbone diagram or cause-and-effect diagram.
It was developed by Kaoru Ishikawa, a Japanese engineer, in the 1960s and is widely used in various areas, including engineering, manufacturing, project management, among others. The Ishikawa diagram is a graphical tool that displays a list of possible causes for a specific problem and helps identify the root causes of performance problems.
What are the benefits of its application in asset management?
Its applicability in asset management allows maintenance managers to identify the underlying causes of performance problems, such as frequent failures, low productivity, or excessive downtime. By understanding the root causes of the problem, maintenance managers can take preventive measures to avoid the problem from occurring again in the future.
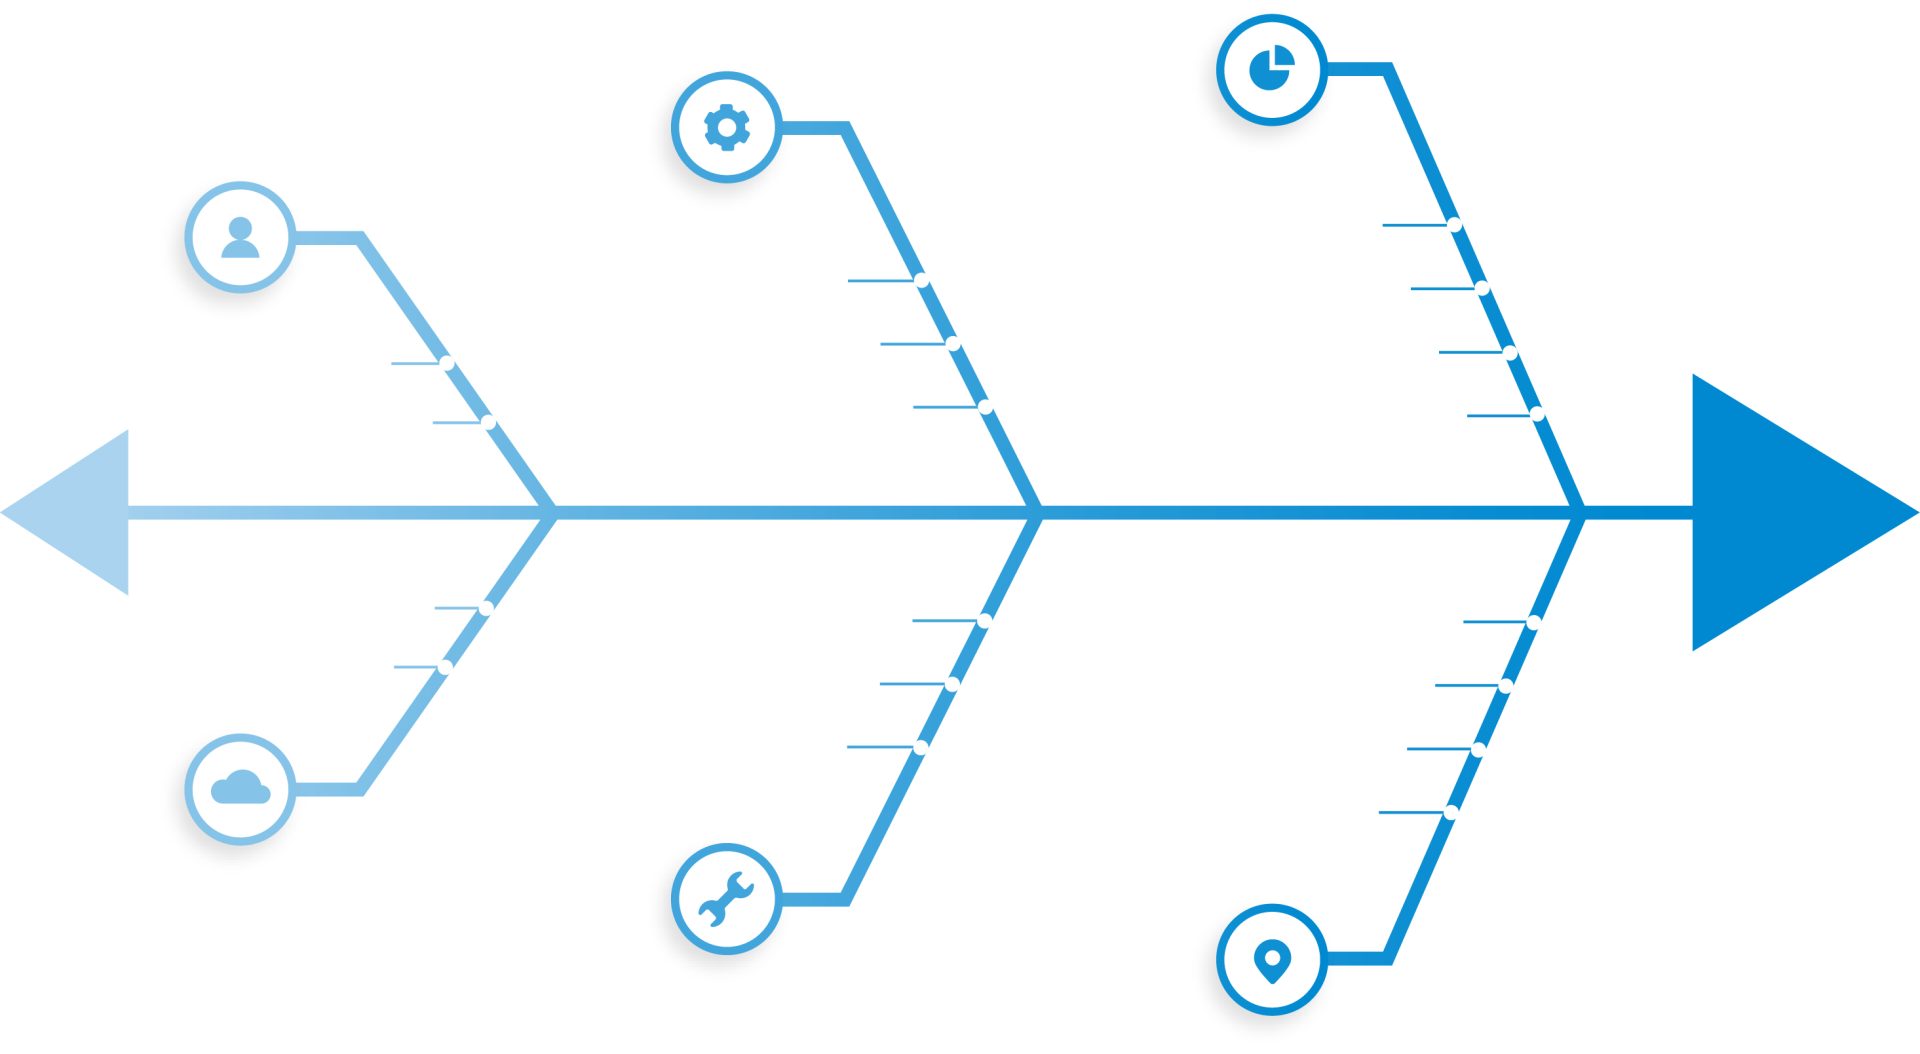
For example, if an asset experiences frequent failures, a maintenance manager can create an Ishikawa diagram to identify possible causes of the failures. The most common categories include people, processes, materials, machines, environment, and measures. Each of these categories is represented as a “spine” on the diagram, with possible causes listed as “spines” on the spine.
By analyzing the Ishikawa diagram, maintenance managers can identify possible causes of failures and take measures to correct them. For example, they may discover that the problem is caused by an operator training issue, an inadequate maintenance process, or a problem with the parts supplier. The Ishikawa diagram is also useful for identifying the major issues that affect overall asset performance. By creating an Ishikawa diagram, maintenance managers can identify the major problems and prioritize them for solution. This allows efforts to be focused on the most critical problems, taking measures to correct them.
In summary, the Ishikawa diagram is a powerful tool for asset management. By using it as part of an asset management program, companies can ensure that their equipment is operating efficiently and productively, leading to a reduction in costs and an increase in productivity.


Leave A Comment